分析 Kubernetes Nodes ‘Not Ready’ 状态
- -节点是 Kubernetes 集群的重要组成部分,负责运行 pod. 根据您的集群设置,节点可以是物理机或虚拟机. 一个集群通常有一个或多个节点,这些节点由控制平面管理. 由于节点负责管理工作负载,因此您需要确保所有节点都正常运行. 该 kubectl get nodes命令可用于检查节点的状态.
节点是 Kubernetes 集群的重要组成部分,负责运行 pod。根据您的集群设置,节点可以是物理机或虚拟机。 一个集群通常有一个或多个节点,这些节点由控制平面管理。
由于节点负责管理工作负载,因此您需要确保所有节点都正常运行。该 kubectl get nodes命令可用于检查节点的状态。
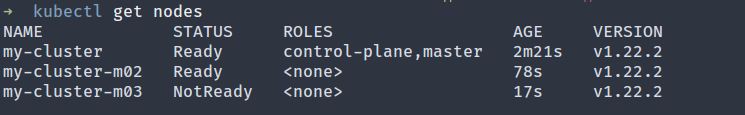 kubectl get nodes 的输出
 具有状态的节点 NotReady意味着由于潜在问题,它不能用于运行 pod。它本质上用于调试 NotReady状态中的节点,以便它不会闲置。
在本文中,您将了解节点可能进入该状态的一些可能原因 NotReady以及如何对其进行调试。
如前所述,集群中的每个节点都用于运行 pod。在节点上调度 Pod 之前,Kubernetes 会检查该节点是否能够运行 Pod。 STATUS输出中的列表示 kubectl get nodes状态。此列中的可能值为:
Ready:节点健康并准备好接受 pod。NotReady: 节点遇到了一些问题,无法在其上调度 pod。SchedulingDisabled: 节点被标记为不可调度。 这可以使用kubectl cordon命令来完成。Unknown:控制平面无法访问该节点。有一个节点处于 NotReady状态意味着该节点实际上未被使用,并且会在不参与运行 pod 的情况下累积成本。此外,丢失节点会对您的生产工作负载产生负面影响。
为了让您的应用程序顺利运行, 您必须快速调试它们。
节点进入该状态可能有多种原因 NotReady。本节将回顾导致此错误的一些最常见原因。
要正常运行,节点必须有足够的磁盘空间、内存和足够的处理能力。如果一个 节点的磁盘空间不足或可用内存不足,它将进入该 NotReady状态。如果进程有压力, 比如节点上运行的进程太多,也会改变状态 NotReady。
如果节点上没有正确配置网络或无法连接到互联网,则节点将无法与主节点通信,并被列为 NotReady。
kubelet是在每个节点上运行的代理。它负责与 Kubernetes API服务器通信并注册节点。如果 kubelet 在节点上崩溃或停止,将无法与 API Server 通信并处于状态 NotReady。
kube-proxy是运行在每个节点上并维护网络规则的网络代理。这些规则允许从集群内部或外部与您的 pod 进行网络通信。如果 kube-proxy 崩溃或停止,节点将处于状态 NotReady。
假设您正在使用GKE或 EKS等云托管解决方案。在这种情况下,一些特定于供应商的问题可能会阻止您的节点正常运行并与控制平面通信。这些问题可能是 IAM 配置错误、网络规则配置错误等。
如您所见, NotReady状态可能由多种问题引起。本节将帮助您 确定问题的根本原因。但是,必须了解如何解决这些问题取决于确切原因和您的集群设置。没有放之四海而皆准的解决方案。但是,一旦您确定了根本原因,解决它应该会更容易。
首先,确保每个节点只有一个 kube-proxypod 并且处于 Runningstate。
kubectl get pods -n kube-system -o wide
输出可能如下所示:
| 姓名 | 准备好 | 地位 | 年龄 | 知识产权 | 节点 | 提名节点 | 就绪门 | |
|---|---|---|---|---|---|---|---|---|
| kube-代理-nhbtp | 1/1 | 跑步 | 2 (11 小时前) | 2d16h | 192.168.99.10 | 1 我的集群 | <无> | <无> |
| kube-proxy-tkmsk | 1/1 | 跑步 | 2 (11 小时前) | 2d16h | 192.168.99.10 | 3 我的集群-m03 | <无> | <无> |
| kube-proxy-vk4ch | 1/1 | 跑步 | 2 (11 小时前) | 2d16h | 192.168.99.10 | 2 我的集群-m02 | <无> | <无> |
如果任何一个 pod 处于除 之外的某种状态 Running,请使用以下命令获取更多信息:
kubectl describe pod yourPodName -n kube-system
Events部分记录了 pod 上的各种事件,它可能是开始寻找任何错误的好地方 。
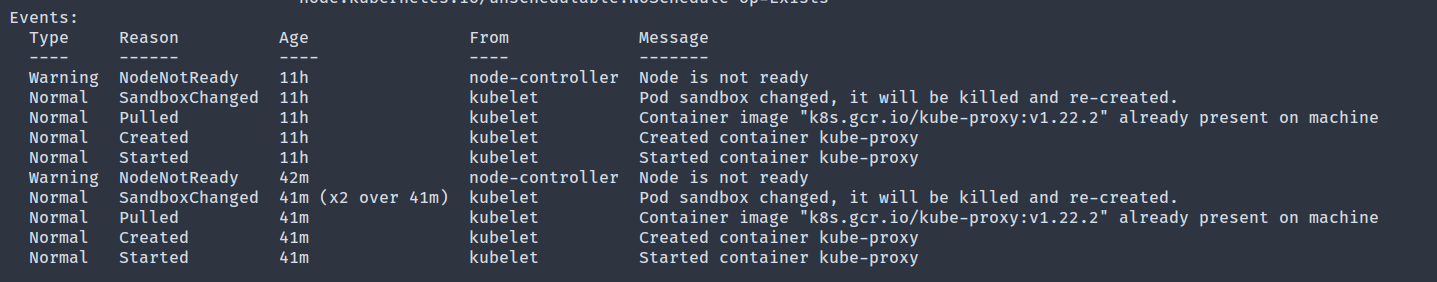 输出中的事件部分
您可以通过运行以下命令来访问 pod 日志:
kubectl logs yourPodName -n kube-system
日志和事件列表是开始查找任何问题的好地方 。
如果您的节点没有 kube-proxypod,那么您需要检查 kube-proxydaemonset,它负责在每个节点上运行一个 kube-proxy pod。
kubectl describe daemonset kube-proxy -n kube-system
此命令的输出可能会揭示 daemonset 的任何可能问题。
运行以下命令以获取有关未就绪节点的详细信息:
kubectl describe node nodeName
在输出中,该 Conditions部分显示节点是否耗尽资源。
 输出中的条件部分
以下条件可用:
MemoryPressure:如果是 True,说明节点 内存不足。DiskPressure: True此字段中的值表示该节点缺少足够的空间。PIDPressure:如果节点上运行的进程过多,则此字段将为 True。NetworkUnavailable:如果节点的网络配置不正确,这将是 True。Ready:如果节点健康并准备好接受 pod,这将是 True。在该字段中,a False相当于输出 NotReady中的状态 get nodes。它也可以有 Unknown值,这意味着节点控制器最近没有收到节点的消息 node-monitor-grace-period(默认为 40 秒)。如果前四个条件中的任何一个是 True,则您已确定问题所在。
如果所有 Conditions字段都显示 Unknown,则可能暗示节点上的 kubelet 进程遇到了一些问题。
 条件字段显示未知
 要对此进行调试,首先通过 SSH 进入节点并检查 kubelet 进程的状态。如果它作为 systemd 服务运行,请使用以下命令:
systemctl status kubelet
如果该 Active字段显示 inactive (dead),则表示 kubelet 进程已停止。
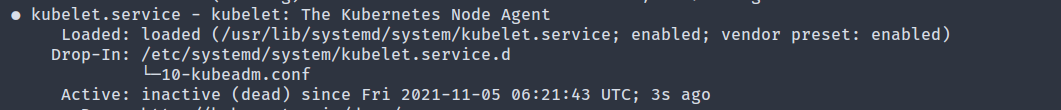 输出的活跃字段
 要揭示崩溃的可能原因,请使用以下命令检查日志:
journalctl -u kubelet
问题解决后,重新启动 kubelet:
systemctl restart kubelet
如果该 Conditions字段显示 NetworkUnavailable,则表明节点与控制平面之间的网络通信存在问题。
一些可能的修复:
您可以从节点内运行以下命令以验证它是否可以访问 API 服务器。
nc -vz <your-api-server-endpoint> 443
如果输出显示 succeeded,则网络通信工作正常。
如果您使用的是 EKS 或 GKE 等云提供商,如果您已经用尽了所有其他调试技术,有时值得研究供应商特定的问题。EKS 有一个非常详细的 指南,您可以遵循。
GKE 提供 自动修复功能,可以尝试修复处于该 NotReady状态达给定时间量的节点。如果一切都失败了,您可以随时与您的云提供商联系以获得更多帮助。
有一个节点处于 NotReady状态是不可取的,需要立即修复。但是,发生这种情况的原因有多种,要查明确切原因可能具有挑战性。本文讨论了您可能会遇到该 NotReady命令的一些常见原因及其解决方案。
您越早捕捉到进入该 NotReady状态的节点,快速调试它的机会就越高。您还可以查看导致此问题发生的所有事件,从而快速识别并解决问题。
Nodes are a vital component of a Kubernetes clusterand are responsible for running the pods. Depending on your cluster setup, a node can be a physical or a virtual machine. A cluster typically has one or multiple nodes, which are managed by the control plane.
Because nodes do the heavy lifting of managing the workload, you want to make sure all your nodes are running correctly. The kubectl get nodescommand can be used to check the state of your nodes.
Output of kubectl get nodes A node with a NotReadystatus means it can’t be used to run a pod because of an underlying issue. It’s essentially used to debug a node in the NotReadystate so that it doesn’t lie unused.
In this article, you’ll learn a few possible reasons why a node might enter the NotReadystate and how you can debug it.
As mentioned earlier, each node in a cluster is used to run pods. Before a pod is scheduled on a node, Kubernetes checks whether the node is capable of running the pod or not. The STATUScolumn in the output of kubectl get nodesrepresents the status. The possible values in this column are:
Ready: The node is healthy and ready to accept pods.NotReady: The node has encountered some issue and a pod cannot be scheduled on it.SchedulingDisabled: The node is marked as unschedulable. This can be done using the kubectl cordoncommand.Unknown: The node is unreachable by the control plane.Having a node in the NotReadystate means that the node is effectively unused and will accumulate costs without participating in running pods. Furthermore, losing a node can negatively impact your production workload.
In order for your application to run smoothly, you must debug them quickly.
There can be various reasons why a node might enter the NotReadystate. This section will review some of the most common reasons for this error.
To operate normally, a node must have sufficient disk space, memory, and sufficient processing ability. If a node is running low on disk spaceor the available memory is low, it will go into the NotReadystate. If pressure exists on the processes, egtoo many processes are running on the node, it will also change to the NotReadystate.
If the network has not been correctly configured on the node or it can’t reach the internet, the node will be unable to communicate with the master node and will be listed as NotReady.
kubeletis an agent that runs on each node. It is responsible for communicating with the Kubernetes APIserver and registering the nodes. If kubelet crashes or stops on the node, it will not be able to communicate with the API Server and will be in the NotReadystate.
kube-proxyis a network proxy that runs on each node and maintains the network rules. These rules allow network communication to your pods from inside or outside your cluster. If kube-proxy crashes or stops, the node will be in the NotReadystate.
Suppose you’re using a cloud-hosted solution like GKEor EKS. In that case, some vendor-specific issues may be preventing your nodes from operating normally and communicating with the control plane. These issues could be IAM misconfiguration, misconfigured network rules, etc.
As you can see, the NotReadystatus can be caused by a multitude of issues. This section will help you identifythe root cause of the problem. However, it’s essential to understand that how you go about fixing these issues depends on the exact cause and your cluster setup. There are no one-size-fits-all solutions. But, once you identify the root cause, it should be easier to resolve it.
First, ensure that each node has exactly one kube-proxypod and is in the Runningstate.
The output might look like this:
| NAME | READY | STATUS | AGE | IP | NODE | NOMINATED NODE | READINESS GATES | |
|---|---|---|---|---|---|---|---|---|
| kube-proxy-nhbtp | 1/1 | Running | 2 (11h ago) | 2d16h | 192.168.99.10 | 1 my-cluster | <none> | <none> |
| kube-proxy-tkmsk | 1/1 | Running | 2 (11h ago) | 2d16h | 192.168.99.10 | 3 my-cluster-m03 | <none> | <none> |
| kube-proxy-vk4ch | 1/1 | Running | 2 (11h ago) | 2d16h | 192.168.99.10 | 2 my-cluster-m02 | <none> | <none> |
If any one pod is in some state other than Running, use the following command to get more information:
The Eventssection logs the various events on the pod, and it could be an excellent place to start looking for any mishaps.
The events section in the output
You can get access to the pod logs by running the following command:
The logsand the events list is a good place to start looking for any issues.
If your node does not have a kube-proxypod, then you need to inspect the kube-proxydaemonset, which is responsible for running one kube-proxy pod on each node.
The output of this command might reveal any possible issue with the daemonset.
Run the following command to get detailed information about a node that is not ready:
In the output, the Conditionssection shows if the node is running out of resources or not.
The conditions section in the output
The following conditions are available:
MemoryPressure: If True, it indicates that the node is running out of memory.DiskPressure: A Truevalue in this field indicates that the node lacks enough space.PIDPressure: If too many processes are running on the node, this field will be True.NetworkUnavailable: If the network for the node is not correctly configured, this will be True.Ready: If the node is healthy and ready to accept pods, this will be True. In this field, a Falseis equivalent to the NotReadystatus in the get nodesoutput. It can also have the Unknownvalue, which means the node controller has not heard from the node in the last node-monitor-grace-period(defaults to 40 seconds).If any one of the first four conditions is True, you have identified the problem.
If all the Conditionsfields show Unknown, it might hint that the kubelet process on the node has run into some issues.
The conditions field shows unknown To debug this, first SSH into the node and check the status of the kubelet process. If it’s running as a systemd service, use the following command:
If the Activefield shows inactive (dead), it means the kubelet process has stopped.
The active field of the output To reveal the possible reason for the crash, check the logs with the following command:
Once the issue is fixed, restart kubelet with:
If the Conditionsfield shows NetworkUnavailable, it indicates an issue in the network communication between the node and the control plane.
A few possible fixes:
You can run the following command from within the node to verify that it can reach the API server.
If the output shows succeeded, then network communication is working correctly.
If you’re using a cloud provider like EKS, or GKE, sometimes it’s worth looking into vendor-specific issues if you’ve exhausted all other debugging techniques. EKS has an extremely detailed guidethat you can follow.
GKE provides an auto repairfeature that can attempt to repair a node that has been in the NotReadystate for a given amount of time. If all else fails, you can always get in touch with your cloud provider for more assistance.
Having a node in the NotReadystate is undesirable and needs to be fixed immediately. However, there are multiple reasons this might occur, and it can be challenging to pinpoint the exact cause. This article discussed some common reasons you may encounter the NotReadycommand and solutions for it.
The earlier you can catch nodes entering the NotReadystate, the higher your chances of quickly debugging it. You can also see all the events leading up to this, allowing you to quickly identify and solve the issue.