.NET Core is designed to be cross-platform, modular and optimized for cloud. What if there is a exception or a memory issue of a .NET Core application on Linux platform? On Windows, we have a set of tools to do different analysis. For example, I can take a process dump by ProcDump and feed it to WinDBG for exception or memory analysis.
Actually, we can do similar things on Linux for .NET Core application now.
Tools
Simply, here is a cheat sheet of the different tools on Windows and Linux:
| Linux | Windows |
| CPU sampling | perf, BCC | ETW |
| Dynamic tracing | perf, BCC | X |
| Static tracing | LTTng | ETW |
| Dump generation | gcore, ProcDump | ProcDump, WER |
| Dump anlysis | LLDB | VS, WinDBG |
LLDB
The LLDB debugger is conceptually similar to the native Windows debugging tools in that it is a low level and command live driven debugger. It is available for a number of different *NIX systems as well as MacOS. Part of the reason the .NET Core team chose the LLDB debugger was for its extensibility points that allowed them to create the SOS plugin which can be used to debug .NET core applications. The SOS LLDB plugin contains the same commands that we have grown accustomed to in the Windows world. Therefore, LLDB is the ideal debugger for .NET Core on Linux.
For .NET Core version 1.x and 2.0.x, libsosplugin.so is built for and will only work with version 3.6 of LLDB. For .NET Core 2.1, the plugin is built for 3.9 LLDB and will work with 3.8 and 3.9 LLDB.
So you need to download and install correct version of LLDB into the box.
Install instruction for LLDB.
ProcDump for Linux
Microsoft has shipped ProcDump to Linux which provides a convenient way for Linux developers to create core dumps of their application based on performance triggers. Eventually, the ProcDump will call gcore on Linux to generate the core dump. It is convenient not only because it will help you to install and setup gcore automatically, but also helps to monitor the application and capture core dump automatically based on specific trigger conditions.
Install instruction for ProcDump of Linux.
SOS plugin for LLDB
The SOS Debugging Extension helps you debug managed programs in debugger by providing information about the internal Common Language Runtime (CLR) environment. The .NET Core team also bring this available on Linux for LLDB.
On Linux, the SOS plugin shipped with .NET Core SDK, you can find it here: /usr/share/dotnet/shared/Microsoft.NETCore.App/2.0.0/libsosplugin.so
Debug It
Attach to a process
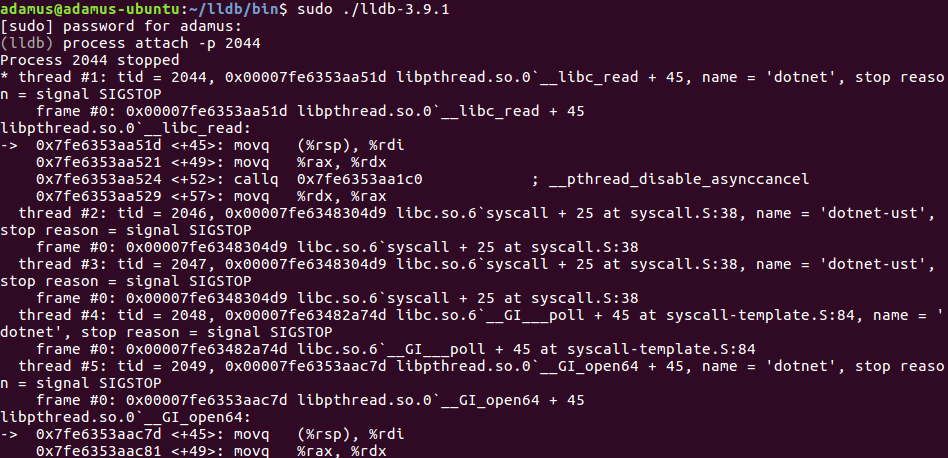
Find the pid of the dotnet application, then launch LLDB and type: process attach -p <PID>to attach the debugger to your dotnet core application.
Once LLDB is attached, the output will show all the frames from the currently selected thread, but it only will show the native frames.
Loading SOS plugin
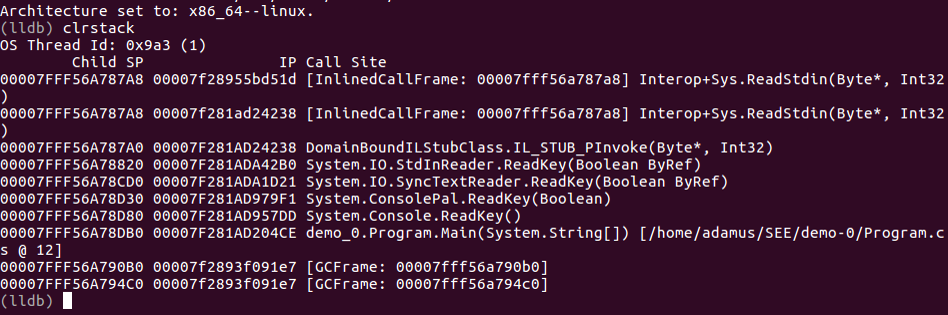
At the LLDB prompt, type: plugin load libsosplugin.so.
Then type: clrstack. You will see clearly what managed code is being executed for that thread.
Capture Core Dumps by ProcDump for Linux
As with any debug session that involves production running applications, it is not a first choice to live attaching to the process. Similar to Windows, Linux utilizes a approach to postmortem debugging with core dumps (memory dump).
In order to enable core dumps generation, type: ulimit -c unlimitedin terminal. This command sets the generated maximum core file size to unlimited in current terminal session.
To generate core dump using ProcDump, type: sudo procdump [options] -p <PID of the app>. You can use the options for ProcDump as below:
1
2
3
4
5
6
7
8
9
10
| Usage: procdump [OPTIONS...] TARGET
OPTIONS
-C CPU threshold at which to create a dump of the process from 0 to 100 * nCPU
-c CPU threshold below which to create a dump of the process from 0 to 100 * nCPU
-M Memory commit threshold in MB at which to create a dump
-m Trigger when memory commit drops below specified MB value.
-n Number of dumps to write before exiting
-s Consecutive seconds before dump is written (default is 10)
TARGET must be exactly one of these:
-p pid of the process
|
Open the dump in LLDB
Launch LLDB and type in prompt: target create -c <dump file path>
Load SOS plugin type any command you need for the memory analysis. The available command are list below:
1
2
3
4
5
6
7
8
9
10
11
12
13
14
15
16
17
18
19
20
21
22
23
24
25
26
27
28
29
30
31
32
33
34
35
36
37
38
| Type "soshelp <functionname>" for detailed info on that function.
Object Inspection Examining code and stacks
----------------------------- -----------------------------
DumpObj (dumpobj) Threads (clrthreads)
DumpArray ThreadState
DumpStackObjects (dso) IP2MD (ip2md)
DumpHeap (dumpheap) u (clru)
DumpVC DumpStack (dumpstack)
GCRoot (gcroot) EEStack (eestack)
PrintException (pe) ClrStack (clrstack)
GCInfo
EHInfo
bpmd (bpmd)
Examining CLR data structures Diagnostic Utilities
----------------------------- -----------------------------
DumpDomain VerifyHeap
EEHeap (eeheap) FindAppDomain
Name2EE (name2ee) DumpLog (dumplog)
DumpMT (dumpmt) CreateDump (createdump)
DumpClass (dumpclass)
DumpMD (dumpmd)
Token2EE
DumpModule (dumpmodule)
DumpAssembly
DumpRuntimeTypes
DumpIL (dumpil)
DumpSig
DumpSigElem
Examining the GC history Other
----------------------------- -----------------------------
HistInit (histinit) FAQ
HistRoot (histroot) Help (soshelp)
HistObj (histobj)
HistObjFind (histobjfind)
HistClear (histclear)
|
Profiling the .NET Core Application on Linux
To gather detailed information about a performance issue of .NET Core Application on Linux, you can follow the simple instructions here:
- Download perfcollectscript provided by .NET Core team.
curl -OL http://aka.ms/perfcollect - Make the script executable.
chmod +x perfcollect - Install prerequisites (perf and LTTng):
sudo ./perfcollect install - Setup the application shell and enables tracing configuration:
export COMPlus_PerfMapEnabled=1
export COMPlus_EnableEventLog=1 - Run collection:
./perfcollect collect tracefile - Copy the tracefile.zip file to a Windowsmachine.
- Download PerfViewon Windows box.
- Open the trace in PerfView, then you can explore the CPU sampling data. Flame Graph is also available here.
Using BPF Complier Collection (BCC)is another good choice for performance analysis as BPF is more flexible and efficiency. Please follow the tutorial of BCC.
Reference: