

Metrics 1.3.6
Metrics是一个十分强大的分析工具,主要分析代码的复杂性。同时可以统计如包的依赖性、代码的有效行数、方法的有效行数、包的数量、属性的数量等等。
Run Eclipse, go to Help menu -> Software Updates -> Find and Install ... On the opening dialog choose Search for new features to install. Add a new Remote site with the following url http://metrics.sourceforge.net/update and follow the instructions for installation.
To use the metrics plugin you have to be in a Java or Java Browsing perspective or any other perspective that shows java resources as source folders, packages and compilation units. The simple resource perspective won't do. This makes sense since the metrics are all about counting aspects of your java code.
To start using the Metrics View, use Windows -> Show View -> Other and navigate to the Metrics View, as shown in the next image.
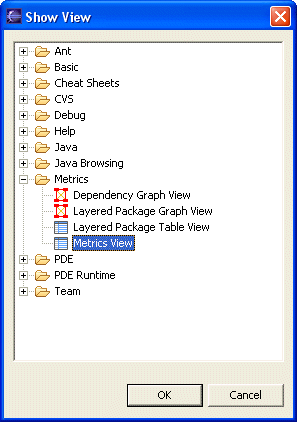
Initially the resulting view will show a brief usage message because no metrics have been calculated yet. To start collecting metrics for a project, right click on the project and from the popup menu select "Metrics->Enable" (or alternatively, use the properties page ).This will tell Eclipse to calculate metrics every time a compile happens. Now that you've enabled a project, the easiest way to calculate all its metrics is to do a full rebuild of that project. The metrics view will indicate the progress of the metrics calculations as they are being performed in the background. When it's all done, the metrics view will look something like this:
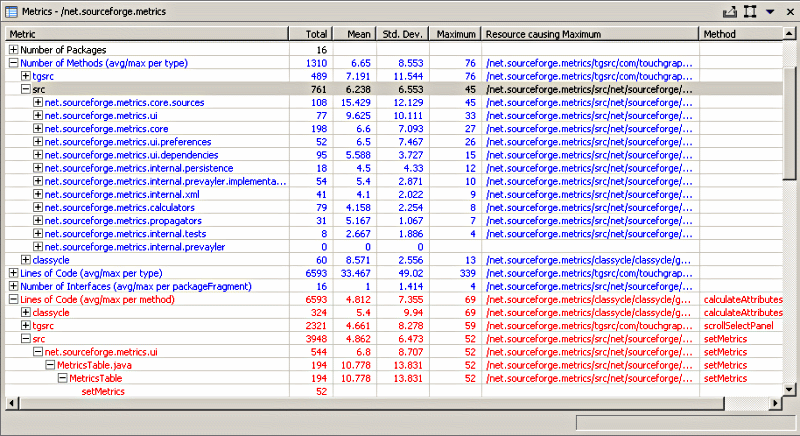
Note that any metric shown in blue can be double-clicked to navigate to the resource causing the maximum value for the metric. Since 1.2.0, the metrics table is actualy a table tree, allowing you to expand each metric to show the values at levels below the selected resource. The child elements at each level are sorted in descending metric (maximum) value order.
java版的Metric工具介绍-hustfxj-ChinaUnix博客
Metrics是一个给JAVA服务的各项指标提供度量工具的包,在JAVA代码中嵌入Metrics代码,可以方便的对业务代码的各个指标进行监控,同时,Metrics能够很好的跟Ganlia、Graphite结合,方便的提供图形化接口。基本使用方式直接将core包(目前稳定版本3.0.1)导入pom文件即可,配置如下:
<dependency> <groupId>com.codahale.metrics</groupId> <artifactId>metrics-core</artifactId> <version>3.0.1</version> </dependency>
core包主要提供如下核心功能:
- Metrics Registries类似一个metrics容器,维护一个Map,可以是一个服务一个实例。
- 支持五种metric类型:Gauges、Counters、Meters、Histograms和Timers。
- 可以将metrics值通过JMX、Console,CSV文件和SLF4J loggers发布出来。
五种Metrics类型:
1. Gauges
Gauges是一个最简单的计量,一般用来统计瞬时状态的数据信息,比如系统中处于pending状态的job。测试代码
点击(此处)折叠或打开
- package com.netease.test.metrics;
- import com.codahale.metrics.ConsoleReporter;
- import com.codahale.metrics.Gauge;
- import com.codahale.metrics.JmxReporter;
- import com.codahale.metrics.MetricRegistry;
- import java.util.Queue;
- import java.util.concurrent.LinkedBlockingDeque;
- import java.util.concurrent.TimeUnit;
- /**
- * User: hzwangxx
- * Date: 14-2-17
- * Time: 14:47
- * 测试Gauges,实时统计pending状态的job个数
- */
- public class TestGauges {
- /**
- * 实例化一个registry,最核心的一个模块,相当于一个应用程序的metrics系统的容器,维护一个Map
- */
- private static final MetricRegistry metrics = new MetricRegistry();
- private static Queue<String> queue = new LinkedBlockingDeque<String>();
- /**
- * 在控制台上打印输出
- */
- private static ConsoleReporter reporter = ConsoleReporter.forRegistry(metrics).build();
- public static void main(String[] args) throws InterruptedException {
- reporter.start(3, TimeUnit.SECONDS);
- //实例化一个Gauge
- Gauge<Integer> gauge = new Gauge<Integer>() {
- @Override
- public Integer getValue() {
- return queue.size();
- }
- };
- //注册到容器中
- metrics.register(MetricRegistry.name(TestGauges.class, "pending-job", "size"), gauge);
- //测试JMX
- JmxReporter jmxReporter = JmxReporter.forRegistry(metrics).build();
- jmxReporter.start();
- //模拟数据
- for (int i=0; i<20; i++){
- queue.add("a");
- Thread.sleep(1000);
- }
- }
- }
- /*
- console output:
- 14-2-17 15:29:35 ===============================================================
- -- Gauges ----------------------------------------------------------------------
- com.netease.test.metrics.TestGauges.pending-job.size
- value = 4
- 14-2-17 15:29:38 ===============================================================
- -- Gauges ----------------------------------------------------------------------
- com.netease.test.metrics.TestGauges.pending-job.size
- value = 6
- 14-2-17 15:29:41 ===============================================================
- -- Gauges ----------------------------------------------------------------------
- com.netease.test.metrics.TestGauges.pending-job.size
- value = 9
- */
- JMX Gauges—提供给第三方库只通过JMX将指标暴露出来。
- Ratio Gauges—简单地通过创建一个gauge计算两个数的比值。
- Cached Gauges—对某些计量指标提供缓存
Derivative Gauges—提供Gauge的值是基于其他Gauge值的接口。
2. Counter
Counter是Gauge的一个特例,维护一个计数器,可以通过inc()和dec()方法对计数器做修改。使用步骤与Gauge基本类似,在MetricRegistry中提供了静态方法可以直接实例化一个Counter。
点击(此处)折叠或打开
- package com.netease.test.metrics;
- import com.codahale.metrics.ConsoleReporter;
- import com.codahale.metrics.Counter;
- import com.codahale.metrics.MetricRegistry;
- import java.util.LinkedList;
- import java.util.Queue;
- import java.util.concurrent.TimeUnit;
- import static com.codahale.metrics.MetricRegistry.*;
- /**
- * User: hzwangxx
- * Date: 14-2-14
- * Time: 14:02
- * 测试Counter
- */
- public class TestCounter {
- /**
- * 实例化一个registry,最核心的一个模块,相当于一个应用程序的metrics系统的容器,维护一个Map
- */
- private static final MetricRegistry metrics = new MetricRegistry();
- /**
- * 在控制台上打印输出
- */
- private static ConsoleReporter reporter = ConsoleReporter.forRegistry(metrics).build();
- /**
- * 实例化一个counter,同样可以通过如下方式进行实例化再注册进去
- * pendingJobs = new Counter();
- * metrics.register(MetricRegistry.name(TestCounter.class, "pending-jobs"), pendingJobs);
- */
- private static Counter pendingJobs = metrics.counter(name(TestCounter.class, "pedding-jobs"));
- // private static Counter pendingJobs = metrics.counter(MetricRegistry.name(TestCounter.class, "pedding-jobs"));
- private static Queue<String> queue = new LinkedList<String>();
- public static void add(String str) {
- pendingJobs.inc();
- queue.offer(str);
- }
- public String take() {
- pendingJobs.dec();
- return queue.poll();
- }
- public static void main(String[]args) throws InterruptedException {
- reporter.start(3, TimeUnit.SECONDS);
- while(true){
- add("1");
- Thread.sleep(1000);
- }
- }
- }
- /*
- console output:
- 14-2-17 17:52:34 ===============================================================
- -- Counters --------------------------------------------------------------------
- com.netease.test.metrics.TestCounter.pedding-jobs
- count = 4
- 14-2-17 17:52:37 ===============================================================
- -- Counters --------------------------------------------------------------------
- com.netease.test.metrics.TestCounter.pedding-jobs
- count = 6
- 14-2-17 17:52:40 ===============================================================
- -- Counters --------------------------------------------------------------------
- com.netease.test.metrics.TestCounter.pedding-jobs
- count = 9
- */
Meters用来度量某个时间段的平均处理次数(request per second),每1、5、15分钟的TPS。比如一个service的请求数,通过metrics.meter()实例化一个Meter之后,然后通过meter.mark()方法就能将本次请求记录下来。统计结果有总的请求数,平均每秒的请求数,以及最近的1、5、15分钟的平均TPS。
点击(此处)折叠或打开
- package com.netease.test.metrics;
- import com.codahale.metrics.ConsoleReporter;
- import com.codahale.metrics.Meter;
- import com.codahale.metrics.MetricRegistry;
- import java.util.concurrent.TimeUnit;
- import static com.codahale.metrics.MetricRegistry.*;
- /**
- * User: hzwangxx
- * Date: 14-2-17
- * Time: 18:34
- * 测试Meters
- */
- public class TestMeters {
- /**
- * 实例化一个registry,最核心的一个模块,相当于一个应用程序的metrics系统的容器,维护一个Map
- */
- private static final MetricRegistry metrics = new MetricRegistry();
- /**
- * 在控制台上打印输出
- */
- private static ConsoleReporter reporter = ConsoleReporter.forRegistry(metrics).build();
- /**
- * 实例化一个Meter
- */
- private static final Meter requests = metrics.meter(name(TestMeters.class, "request"));
- public static void handleRequest() {
- requests.mark();
- }
- public static void main(String[] args) throws InterruptedException {
- reporter.start(3, TimeUnit.SECONDS);
- while(true){
- handleRequest();
- Thread.sleep(100);
- }
- }
- }
- /*
- 14-2-17 18:43:08 ===============================================================
- -- Meters ----------------------------------------------------------------------
- com.netease.test.metrics.TestMeters.request
- count = 30
- mean rate = 9.95 events/second
- 1-minute rate = 0.00 events/second
- 5-minute rate = 0.00 events/second
- 15-minute rate = 0.00 events/second
- 14-2-17 18:43:11 ===============================================================
- -- Meters ----------------------------------------------------------------------
- com.netease.test.metrics.TestMeters.request
- count = 60
- mean rate = 9.99 events/second
- 1-minute rate = 10.00 events/second
- 5-minute rate = 10.00 events/second
- 15-minute rate = 10.00 events/second
- 14-2-17 18:43:14 ===============================================================
- -- Meters ----------------------------------------------------------------------
- com.netease.test.metrics.TestMeters.request
- count = 90
- mean rate = 9.99 events/second
- 1-minute rate = 10.00 events/second
- 5-minute rate = 10.00 events/second
- 15-minute rate = 10.00 events/second
- */
Histograms主要使用来统计数据的分布情况,最大值、最小值、平均值、中位数,百分比(75%、90%、95%、98%、99%和99.9%)。例如,需要统计某个页面的请求响应时间分布情况,可以使用该种类型的Metrics进行统计。具体的样例代码如下:
点击(此处)折叠或打开
- package com.netease.test.metrics;
- import com.codahale.metrics.ConsoleReporter;
- import com.codahale.metrics.Histogram;
- import com.codahale.metrics.MetricRegistry;
- import java.util.Random;
- import java.util.concurrent.TimeUnit;
- import static com.codahale.metrics.MetricRegistry.name;
- /**
- * User: hzwangxx
- * Date: 14-2-17
- * Time: 18:34
- * 测试Histograms
- */
- public class TestHistograms {
- /**
- * 实例化一个registry,最核心的一个模块,相当于一个应用程序的metrics系统的容器,维护一个Map
- */
- private static final MetricRegistry metrics = new MetricRegistry();
- /**
- * 在控制台上打印输出
- */
- private static ConsoleReporter reporter = ConsoleReporter.forRegistry(metrics).build();
- /**
- * 实例化一个Histograms
- */
- private static final Histogram randomNums = metrics.histogram(name(TestHistograms.class, "random"));
- public static void handleRequest(double random) {
- randomNums.update((int) (random*100));
- }
- public static void main(String[] args) throws InterruptedException {
- reporter.start(3, TimeUnit.SECONDS);
- Random rand = new Random();
- while(true){
- handleRequest(rand.nextDouble());
- Thread.sleep(100);
- }
- }
- }
- /*
- 14-2-17 19:39:11 ===============================================================
- -- Histograms ------------------------------------------------------------------
- com.netease.test.metrics.TestHistograms.random
- count = 30
- min = 1
- max = 97
- mean = 45.93
- stddev = 29.12
- median = 39.50
- 75% <= 71.00
- 95% <= 95.90
- 98% <= 97.00
- 99% <= 97.00
- 99.9% <= 97.00
- 14-2-17 19:39:14 ===============================================================
- -- Histograms ------------------------------------------------------------------
- com.netease.test.metrics.TestHistograms.random
- count = 60
- min = 0
- max = 97
- mean = 41.17
- stddev = 28.60
- median = 34.50
- 75% <= 69.75
- 95% <= 92.90
- 98% <= 96.56
- 99% <= 97.00
- 99.9% <= 97.00
- 14-2-17 19:39:17 ===============================================================
- -- Histograms ------------------------------------------------------------------
- com.netease.test.metrics.TestHistograms.random
- count = 90
- min = 0
- max = 97
- mean = 44.67
- stddev = 28.47
- median = 43.00
- 75% <= 71.00
- 95% <= 91.90
- 98% <= 96.18
- 99% <= 97.00
- 99.9% <= 97.00
- */
5. Timers
Timers主要是用来统计某一块代码段的执行时间以及其分布情况,具体是基于Histograms和Meters来实现的。样例代码如下:
点击(此处)折叠或打开
- package com.netease.test.metrics;
- import com.codahale.metrics.ConsoleReporter;
- import com.codahale.metrics.MetricRegistry;
- import com.codahale.metrics.Timer;
- import java.util.Random;
- import java.util.concurrent.TimeUnit;
- import static com.codahale.metrics.MetricRegistry.name;
- /**
- * User: hzwangxx
- * Date: 14-2-17
- * Time: 18:34
- * 测试Timers
- */
- public class TestTimers {
- /**
- * 实例化一个registry,最核心的一个模块,相当于一个应用程序的metrics系统的容器,维护一个Map
- */
- private static final MetricRegistry metrics = new MetricRegistry();
- /**
- * 在控制台上打印输出
- */
- private static ConsoleReporter reporter = ConsoleReporter.forRegistry(metrics).build();
- /**
- * 实例化一个Meter
- */
- // private static final Timer requests = metrics.timer(name(TestTimers.class, "request"));
- private static final Timer requests = metrics.timer(name(TestTimers.class, "request"));
- public static void handleRequest(int sleep) {
- Timer.Context context = requests.time();
- try {
- //some operator
- Thread.sleep(sleep);
- } catch (InterruptedException e) {
- e.printStackTrace();
- } finally {
- context.stop();
- }
- }
- public static void main(String[] args) throws InterruptedException {
- reporter.start(3, TimeUnit.SECONDS);
- Random random = new Random();
- while(true){
- handleRequest(random.nextInt(1000));
- }
- }
- }
- /*
- 14-2-18 9:31:54 ================================================================
- -- Timers ----------------------------------------------------------------------
- com.netease.test.metrics.TestTimers.request
- count = 4
- mean rate = 1.33 calls/second
- 1-minute rate = 0.00 calls/second
- 5-minute rate = 0.00 calls/second
- 15-minute rate = 0.00 calls/second
- min = 483.07 milliseconds
- max = 901.92 milliseconds
- mean = 612.64 milliseconds
- stddev = 196.32 milliseconds
- median = 532.79 milliseconds
- 75% <= 818.31 milliseconds
- 95% <= 901.92 milliseconds
- 98% <= 901.92 milliseconds
- 99% <= 901.92 milliseconds
- 99.9% <= 901.92 milliseconds
- 14-2-18 9:31:57 ================================================================
- -- Timers ----------------------------------------------------------------------
- com.netease.test.metrics.TestTimers.request
- count = 8
- mean rate = 1.33 calls/second
- 1-minute rate = 1.40 calls/second
- 5-minute rate = 1.40 calls/second
- 15-minute rate = 1.40 calls/second
- min = 41.07 milliseconds
- max = 968.19 milliseconds
- mean = 639.50 milliseconds
- stddev = 306.12 milliseconds
- median = 692.77 milliseconds
- 75% <= 885.96 milliseconds
- 95% <= 968.19 milliseconds
- 98% <= 968.19 milliseconds
- 99% <= 968.19 milliseconds
- 99.9% <= 968.19 milliseconds
- 14-2-18 9:32:00 ================================================================
- -- Timers ----------------------------------------------------------------------
- com.netease.test.metrics.TestTimers.request
- count = 15
- mean rate = 1.67 calls/second
- 1-minute rate = 1.40 calls/second
- 5-minute rate = 1.40 calls/second
- 15-minute rate = 1.40 calls/second
- min = 41.07 milliseconds
- max = 968.19 milliseconds
- mean = 591.35 milliseconds
- stddev = 302.96 milliseconds
- median = 650.56 milliseconds
- 75% <= 838.07 milliseconds
- 95% <= 968.19 milliseconds
- 98% <= 968.19 milliseconds
- 99% <= 968.19 milliseconds
- 99.9% <= 968.19 milliseconds
- */
Metrics提供了一个独立的模块:Health Checks,用于对Application、其子模块或者关联模块的运行是否正常做检测。该模块是独立metrics-core模块的,使用时则导入metrics-healthchecks包。
<dependency> <groupId>com.codahale.metrics</groupId> <artifactId>metrics-healthchecks</artifactId> <version>3.0.1</version> </dependency>
使用起来和与上述几种类型的Metrics有点类似,但是需要重新实例化一个Metrics容器HealthCheckRegistry,待检测模块继承抽象类HealthCheck并实现check()方法即可,然后将该模块注册到HealthCheckRegistry中,判断的时候通过isHealthy()接口即可。如下示例代码:
点击(此处)折叠或打开
- package com.netease.test.metrics;
- import com.codahale.metrics.health.HealthCheck;
- import com.codahale.metrics.health.HealthCheckRegistry;
- import java.util.Map;
- import java.util.Random;
- /**
- * User: hzwangxx
- * Date: 14-2-18
- * Time: 9:57
- */
- public class DatabaseHealthCheck extends HealthCheck{
- private final Database database;
- public DatabaseHealthCheck(Database database) {
- this.database = database;
- }
- @Override
- protected Result check() throws Exception {
- if (database.ping()) {
- return Result.healthy();
- }
- return Result.unhealthy("Can't ping database.");
- }
- /**
- * 模拟Database对象
- */
- static class Database {
- /**
- * 模拟database的ping方法
- * @return 随机返回boolean值
- */
- public boolean ping() {
- Random random = new Random();
- return random.nextBoolean();
- }
- }
- public static void main(String[] args) {
- // MetricRegistry metrics = new MetricRegistry();
- // ConsoleReporter reporter = ConsoleReporter.forRegistry(metrics).build();
- HealthCheckRegistry registry = new HealthCheckRegistry();
- registry.register("database1", new DatabaseHealthCheck(new Database()));
- registry.register("database2", new DatabaseHealthCheck(new Database()));
- while (true) {
- for (Map.Entry<String, Result> entry : registry.runHealthChecks().entrySet()) {
- if (entry.getValue().isHealthy()) {
- System.out.println(entry.getKey() + ": OK");
- } else {
- System.err.println(entry.getKey() + ": FAIL, error message: " + entry.getValue().getMessage());
- final Throwable e = entry.getValue().getError();
- if (e != null) {
- e.printStackTrace();
- }
- }
- }
- try {
- Thread.sleep(1000);
- } catch (InterruptedException e) {
- }
- }
- }
- }
- /*
- console output:
- database1: OK
- database2: FAIL, error message: Can't ping database.
- database1: FAIL, error message: Can't ping database.
- database2: OK
- database1: OK
- database2: FAIL, error message: Can't ping database.
- database1: FAIL, error message: Can't ping database.
- database2: OK
- database1: FAIL, error message: Can't ping database.
- database2: FAIL, error message: Can't ping database.
- database1: FAIL, error message: Can't ping database.
- database2: FAIL, error message: Can't ping database.
- database1: OK
- database2: OK
- database1: OK
- database2: FAIL, error message: Can't ping database.
- database1: FAIL, error message: Can't ping database.
- database2: OK
- database1: OK
- database2: OK
- database1: FAIL, error message: Can't ping database.
- database2: OK
- database1: OK
- database2: OK
- database1: OK
- database2: OK
- database1: OK
- database2: FAIL, error message: Can't ping database.
- database1: FAIL, error message: Can't ping database.
- database2: FAIL, error message: Can't ping database.
- */
metrics提供了对Ehcache、Apache HttpClient、JDBI、Jersey、Jetty、Log4J、Logback、JVM等的集成,可以方便地将Metrics输出到Ganglia、Graphite中,供用户图形化展示。